

Workday Set to Beat Q3 FY2027 Revenue Guidance by 1.9% ($50M)

Kareem Powell
AuthorEvery quarter, Workday tells the market what it expects. Our job in this series is to test that story against the numbers and against a model that has to show its work.
Key numbers
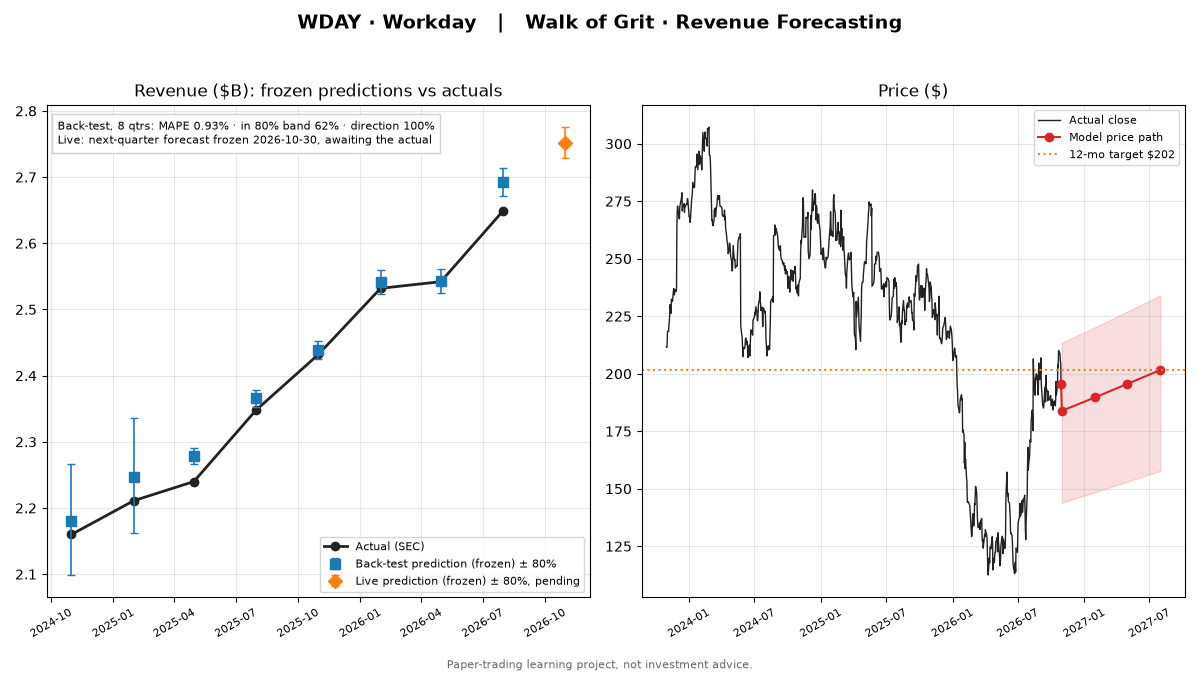
- Latest quarter (ended 2026-07-31): revenue $2.65B actual vs $2.69B predicted (model was 1.6% above actual revenue)
- Next quarter (ending 2026-10-31) forecast: $2.75B, 80% range $2.73B–$2.78B
- Company guidance midpoint: $2.70B
- Method: blend of beat-adjusted guidance (50%), weighted peer comps (25%) and a damped Holt trend (25%); backtest MAPE 0.93% over 8 quarters (beat-adjusted guidance alone: 0.76%)
- Scorecard (frozen predictions vs actuals): back-test 8 quarters, MAPE 0.93%, 62% inside the 80% band, direction right 100%; 2 live predictions frozen today, scored when actuals arrive
- Latest sentiment score: +0.04
- Model 12-month price target $201.62 vs last close $195.46 (+3.2%)
- Paper position: none (sentiment-weighted score did not qualify).
How the forecast is built. I start from the company's own guidance, then adjust it for how much Workday has historically beaten it. That gets cross-checked against a weighted basket of comparable SaaS companies and a smoothed trend line. The blend is what you see in the chart.
The positive override. A miss or a cautious guide isn't the end of the story. It's data. The point is to reframe setbacks as opportunities to learn what the market is pricing in, without pretending to more confidence than the numbers support.
See the interactive charts for WDAY
Paper-trading learning project, not investment advice.